728x90
❗️ Issue
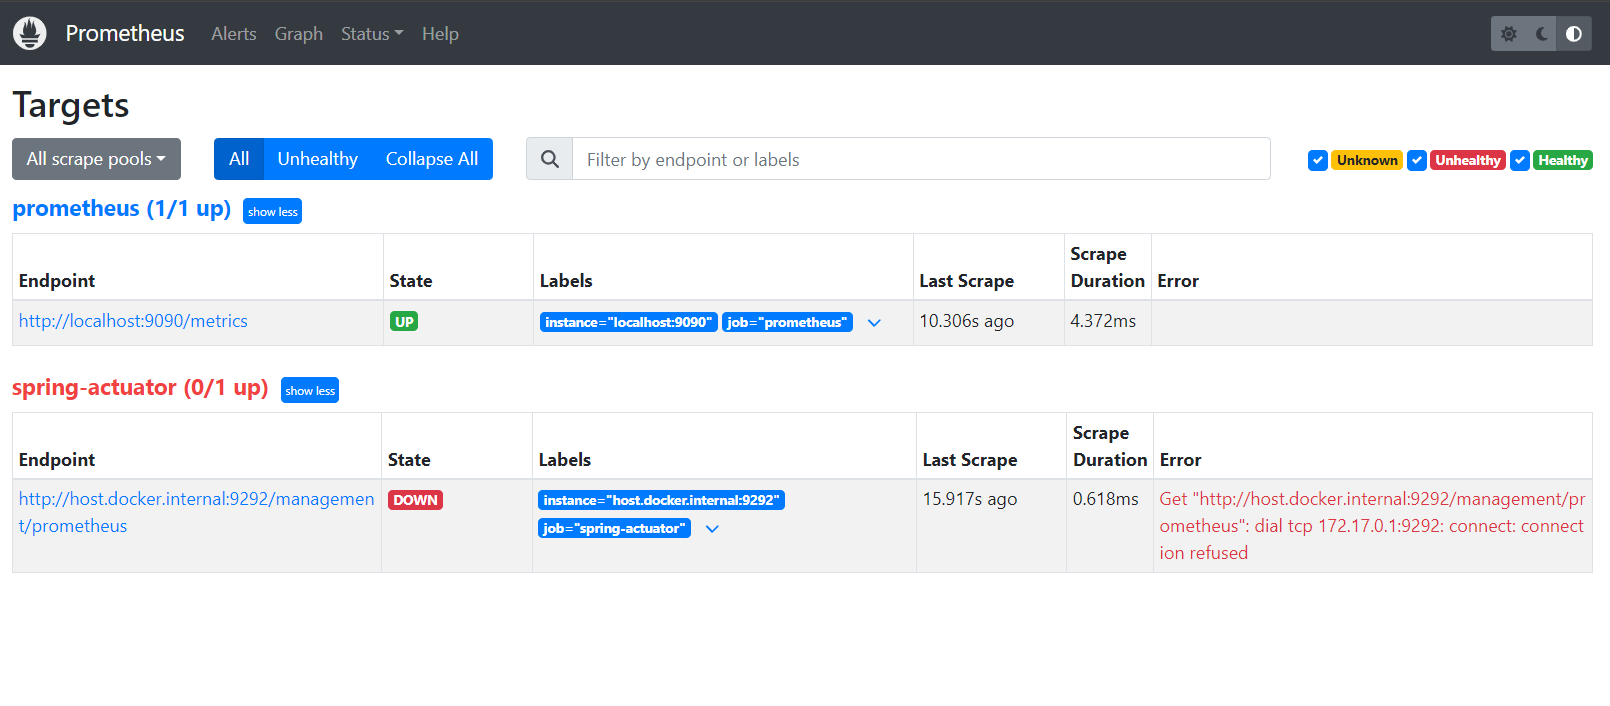
prometheus 연동 확인(상단 네비게이션 바: status > targets)시 아래 에러가 뜨면서 연동이 되지 않았다.
Get "http://localhost:9292/management/prometheus": dial tcp 127.0.0.1:9292: connect: connection refused
그래서 다른 블로그 글을 참고해서 host.docker.internal 로 prometheus.yml의 targets: [' host.docker.internal :9292'] 로 변경했는데도 접속이 안되었다. 참고로 9292는 내가 변경된 액츄에이터 포트이다
💡 Solution
현재 CI/CD 구축 아키텍처는 아래와 같아서, 즉, 컨테이너가 가상 브릿지로 연결되어 있으므로,
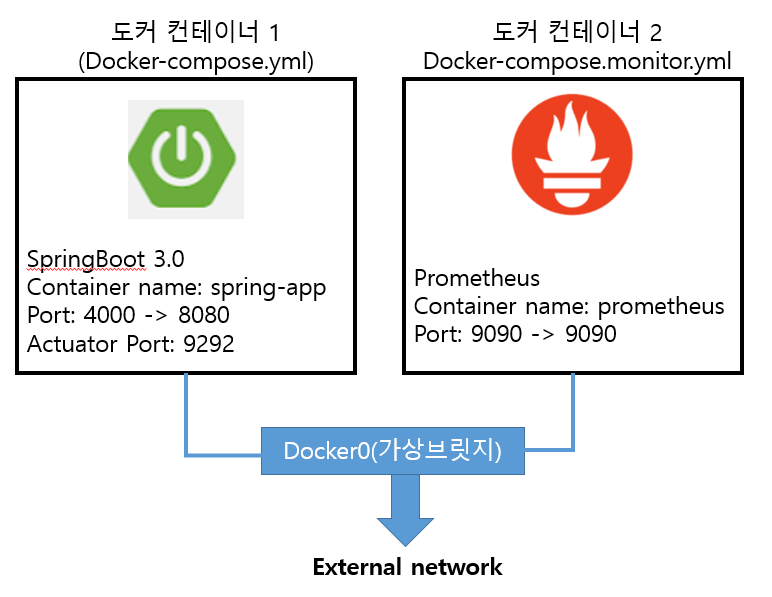
프로메테우스에서 스프링부트의 액츄에이터로 접근하려면 컨테이너명을 써주면 된다.
targets: ["spring-app:9292"] 요렇게 말이다.
아래는 prometheus.yml 전문이다.
# my global config
global:
  scrape_interval: 15s # Set the scrape interval to every 15 seconds. Default is every 1 minute.
  evaluation_interval: 15s # Evaluate rules every 15 seconds. The default is every 1 minute.
  # scrape_timeout is set to the global default (10s).

# Alertmanager configuration
alerting:
  alertmanagers:
    - static_configs:
        - targets:
          # - alertmanager:9093

# Load rules once and periodically evaluate them according to the global 'evaluation_interval'.
rule_files:
  # - "first_rules.yml"
  # - "second_rules.yml"

# A scrape configuration containing exactly one endpoint to scrape:
# Here it's Prometheus itself.
scrape_configs:
  # The job name is added as a label `job=<job_name>` to any timeseries scraped from this config.
  - job_name: "prometheus"

    # metrics_path defaults to '/metrics'
    # scheme defaults to 'http'.

    static_configs:
      - targets: ["localhost:9090"]
  #추가
  - job_name: "jayoung977/backend"
    metrics_path: '/management/prometheus'
    scrape_interval: 10s
    static_configs:
      - targets: ["spring-app:9292"]
해당 부분을 고치면 아래와 같이 잘 작동된다.

참고로 이거는 host.docker.internal 도커에서 호스트 네트워크로 접속하는 내용이다.
나는 도커 컨테이너 끼리 접속이 필요했기때문에 해당 부분이랑 관련이 없었다.
결론: 무작정 블로그에서 갖다쓰기보다 뭔지 정확히 이해하고 쓰자..
해당 부분 관련 블로그도 몇 없어서 2시간 삽질한거 같다..ㅎㅎ
만약 같은 구성인 분이라면 위 블로그 글이 도움이 되기를 바라면서 글을 마친다.
728x90